In today’s competitive landscape, businesses can’t just rely on running marketing campaigns; they need to measure their impact. With so many metrics available, it’s crucial to track the right ones to drive business growth.
Most marketers focus on popular metrics like cost per lead and conversion rate, but there’s more to marketing performance than these alone. To truly understand their strategy’s effectiveness, businesses must dig deeper into their KPIs.
This comprehensive guide will help you explore essential metrics that can transform your business strategy. By mastering these key performance indicators, you’ll be able to make informed decisions and allocate resources effectively.
Understanding Marketing KPIs and Their Importance
To navigate the complex landscape of marketing, businesses must first understand the role of Key Performance Indicators (KPIs). Marketing KPIs are quantifiable measurements that help businesses evaluate the success of their marketing initiatives against predetermined objectives and strategic goals.
What Are Marketing KPIs?
Marketing KPIs are measurable values that demonstrate how effectively a company is achieving its key business objectives through marketing efforts. Unlike general metrics, KPIs are directly tied to business outcomes and provide actionable insights that drive decision-making processes.
- They help assess the performance of specific marketing activities or campaigns based on predefined goals.
- Effective KPI tracking enables marketers to identify which strategies are delivering results and which require adjustment.
- KPIs serve as early indicators of campaign performance, allowing teams to pivot quickly when strategies aren’t meeting expectations.
Why Tracking Marketing KPIs Matters for Business Growth
Tracking marketing KPIs is crucial for business growth as it bridges the gap between marketing activities and business results. By monitoring the right KPIs, businesses can demonstrate ROI to stakeholders and justify marketing investments. The right KPIs vary by business model and objectives; for instance, what works for an e-commerce business may differ from what’s valuable for a B2B SaaS company.
- Modern marketing requires balancing multiple KPIs across different channels to create a comprehensive view of marketing performance.
- By focusing on the most relevant KPIs, businesses can make smarter decisions and maximize returns on their marketing efforts.
Core Business Marketing KPIs
Core business marketing KPIs serve as the backbone of a successful marketing strategy, providing businesses with the insights needed to drive growth and revenue. These key performance indicators are crucial for understanding the effectiveness of marketing efforts and making informed decisions.
Several core business marketing KPIs are particularly important for businesses to track. These include metrics that measure the financial impact of marketing campaigns, the value of customers, and the efficiency of customer acquisition efforts.
Marketing ROI (Return on Investment)
Marketing ROI is a critical KPI that measures the profit gained from marketing investments relative to their cost. It is calculated as (Sales Revenue – Marketing Cost) / Marketing Cost. This metric helps businesses determine which campaigns deliver the best return and guides future budget allocations. A positive ROI indicates that marketing efforts are generating more revenue than they cost, justifying marketing expenditures.
Customer Lifetime Value (CLTV)
CLTV calculates the total revenue expected from a customer over their lifetime. It informs acquisition and retention strategies by helping businesses understand how much to invest in acquiring and retaining customers. A high CLTV indicates that customers are valuable assets to the business.
Customer Acquisition Cost (CAC)
CAC is the total cost of acquiring a new customer, including marketing and sales expenses. Comparing CAC with CLTV reveals the efficiency of customer acquisition efforts. When CLTV significantly exceeds CAC, it indicates a sustainable business model with healthy margins for growth and reinvestment.
Marketing Contribution to Revenue
This KPI quantifies marketing’s direct impact on the company’s bottom line. It is calculated as (Total pipeline from marketing / Total sales pipeline) X 100. For example, if the sales pipeline is worth $500,000 and marketing campaigns contributed $200,000, then marketing’s pipeline contribution is 40%. This metric helps justify marketing budgets and demonstrate value to executive leadership.
These core business KPIs work together to provide a comprehensive view of marketing’s financial impact, connecting marketing activities to business outcomes. By tracking these metrics over time, businesses can reveal trends that inform strategic decisions about resource allocation and marketing focus areas.
Website and Traffic KPIs
Website and traffic KPIs provide valuable insights into how users interact with your site and respond to your marketing strategies. These metrics are crucial for understanding the effectiveness of your online presence and identifying areas for improvement.
Conversion Rate
The conversion rate is a critical KPI that measures the percentage of visitors who complete a desired action on your website, such as filling out a form, signing up for a newsletter, or making a purchase. A higher conversion rate indicates that your marketing efforts are effectively driving user actions.
Traffic Sources
Understanding traffic sources is essential for identifying which channels drive the most valuable visitors to your site. This includes organic search, paid ads, social media, and other referral sources. Tools like Google Analytics help analyze these sources, enabling more strategic budget allocation and content development.
Bounce Rate
The bounce rate measures the percentage of visitors who leave your site after viewing only one page. A high bounce rate can indicate issues with content relevance, user experience, or slow loading times. By analyzing bounce rate alongside other KPIs, you can gain a deeper understanding of how to improve user engagement.
Segmenting these KPIs by factors like device type, geographic location, and referral source can reveal optimization opportunities. For e-commerce sites, additional metrics such as cart abandonment rate and average order value provide a comprehensive view of site performance. Establishing benchmarks based on industry standards helps set realistic goals for improvement.
Content Marketing KPIs
In the realm of content marketing, KPIs serve as the compass that guides marketers toward their goals, helping them navigate through the complexities of digital engagement. As businesses continue to invest heavily in content creation, understanding the metrics that truly matter is essential for maximizing ROI and achieving marketing objectives.
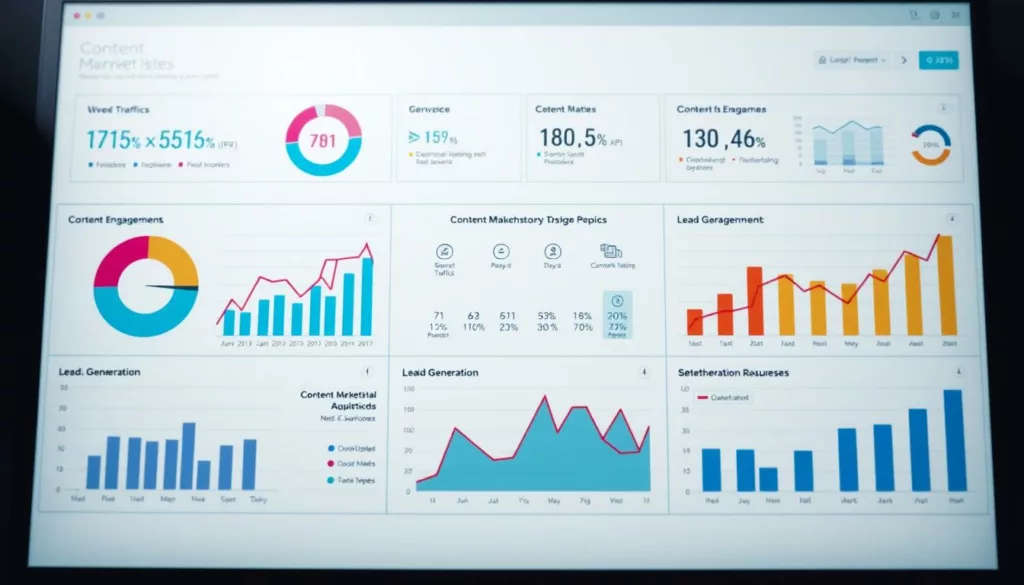
Key Content Marketing KPIs include a mix of metrics that measure both the consumption and impact of content. These indicators help marketers refine their strategies, improve engagement, and ultimately drive business growth.
Organic Traffic
Organic traffic is a foundational KPI for content marketing success. It indicates how well your content ranks in search engines and attracts visitors without paid promotion. High organic traffic suggests that your content is relevant, valuable, and optimized for organic search. To boost organic traffic, focus on creating high-quality, keyword-optimized content that addresses the needs and interests of your target audience.
Time on Page
The average amount of time on page is a critical metric that reveals how engaging and valuable your content is to readers. Longer engagement times suggest that visitors find your material relevant and useful. To improve time on page, consider enhancing your content with multimedia elements, such as videos and infographics, and ensure that your content is well-structured and easy to consume.
Social Shares
Social shares extend your content’s reach beyond your immediate audience, creating valuable social proof and potentially driving additional organic traffic. Making your content easily shareable across different social media channels is essential. A few social shares can lead to viral growth, driving new leads to your website and increasing your social media following. Encourage sharing by incorporating clear calls-to-action and making your content highly relevant and engaging.
Content Engagement Metrics
Content engagement metrics, such as comments, reactions, and backlinks, provide multidimensional feedback on how your audience interacts with your material. These metrics help you understand what resonates with your audience and inform future content creation. For instance, comments on your web pages indicate engagement and can spark conversations about your content, while backlinks from reputable sites can enhance your content’s credibility and search engine ranking.
As highlighted by a seasoned marketer, “The most successful content marketers look beyond vanity metrics to focus on indicators that show genuine audience engagement and business impact.” By tracking and analyzing these key content marketing KPIs, businesses can refine their content strategies, improve engagement, and drive meaningful business outcomes.
Email Marketing KPIs

Understanding and leveraging email marketing KPIs is essential for optimizing campaign performance and achieving business goals. Email marketing KPIs provide insights into how recipients interact with email campaigns, helping marketers refine their strategies.
Email marketing metrics tools are vital for tracking these KPIs, offering a data-driven approach to campaign optimization. By focusing on the right metrics, marketers can significantly improve their email marketing effectiveness.
Open Rate
The open rate is the percentage of recipients who open your emails, reflecting the effectiveness of your subject lines and sender reputation. A high open rate indicates that your subject line and sender name are compelling.
Open rate serves as the gateway metric for email marketing success—without opens, no further engagement is possible, making subject line optimization and sender reputation critical factors.
Click-Through Rate (CTR)
The click-through rate (CTR) measures the percentage of email recipients who click on a link within your email. It assesses how compelling your email content is and its ability to drive actions.
CTR is a crucial metric as it directly reflects the effectiveness of your email content and calls-to-action in motivating recipients to take the next step in their journey with your brand.
Click-to-Open Rate (CTOR)
The click-to-open rate (CTOR) is the percentage of email openers who click on a link within the email. It provides a more refined view of content performance by focusing only on those who opened the email.
CTOR helps isolate content effectiveness from subject line appeal, giving marketers a clearer understanding of how engaging their email content is.
Unsubscribe Rate
The unsubscribe rate is the percentage of recipients who opt out of receiving future emails. High unsubscribe rates may indicate issues with content relevance or frequency.
Unsubscribe rate acts as an early warning system for email program health—sudden spikes may indicate messaging misalignment, excessive frequency, or targeting issues.
Segmenting these email marketing KPIs by campaign type, audience segment, and device can reveal optimization opportunities that drive incremental improvements. Beyond these core metrics, conversion rate from email and revenue per email sent connect email performance directly to business outcomes.
A/B testing subject lines, content formats, and send times while tracking these KPIs enables continuous optimization of your email marketing strategy. Industry benchmarks for these metrics vary widely, making it essential to establish your own baseline and track improvements relative to your historical performance.
Social Media Marketing KPIs
Measuring social media success involves analyzing a range of KPIs that reflect different aspects of a brand’s online activity. These metrics help businesses understand their social media performance and make data-driven decisions to improve their strategies.
Engagement Rate
The engagement rate measures the level of interaction with your content, including likes, comments, shares, and saves, relative to your follower count. It’s a critical KPI because it indicates how well your content resonates with your audience. A higher engagement rate suggests that your content is relevant and appealing, which can lead to increased visibility and reach on social media platforms.
Follower Growth
Follower growth tracks the expansion of your potential audience over time. While the quantity of followers is important, the quality matters more. Relevant followers who engage with your content are more valuable than inactive accounts. Monitoring follower growth helps you understand the effectiveness of your content and engagement strategies.
Reach and Impressions
Reach represents the total number of unique accounts that have seen your posts, while impressions count the total number of times your posts have been viewed. These metrics provide insights into the visibility of your content. A broader reach can enhance brand awareness, but it’s also crucial to focus on engagement to ensure your content resonates with your audience.
Brand Mentions and Sentiment
Brand mentions and sentiment analysis reveal how people talk about your brand beyond your owned channels. Positive mentions can act as free endorsements, enhancing your brand’s reputation. Monitoring brand mentions and sentiment helps you understand your brand’s perception and identify areas for improvement.
By tracking these social media KPIs, businesses can gain a comprehensive understanding of their social media performance and make informed decisions to optimize their marketing strategies.
Paid Advertising KPIs
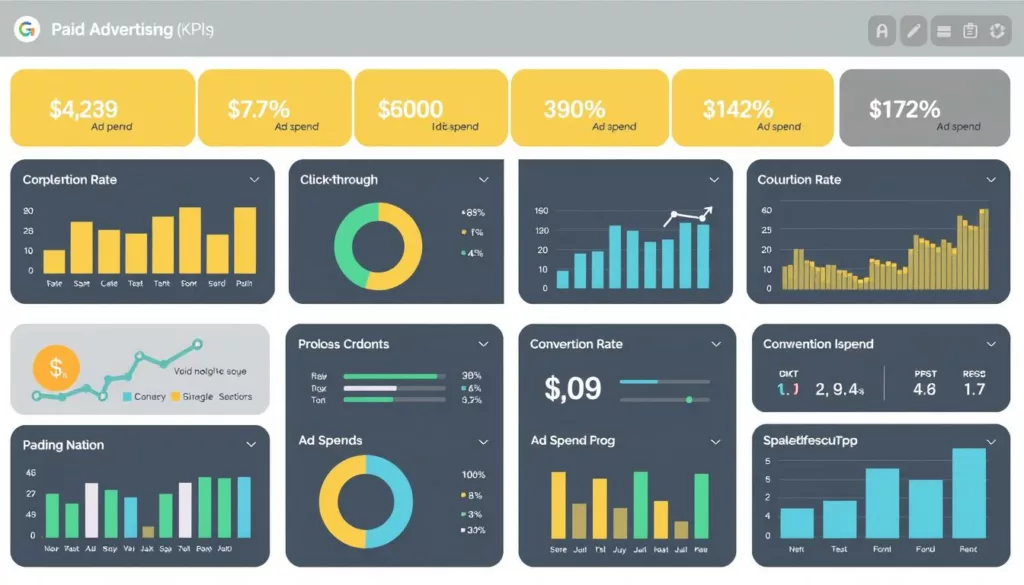
The success of paid advertising campaigns hinges on the ability to monitor and interpret key metrics. Paid advertising KPIs are crucial for understanding campaign performance and making data-driven decisions to optimize ad spend.
Cost Per Click (CPC)
Cost Per Click (CPC) is a fundamental metric that reflects the actual price paid for each ad click. Understanding CPC is vital for budget planning, as it varies significantly by industry and keyword. For instance, the global average CPC for search ads was $2.69 in 2019, while display ads averaged $0.63.
CPC measures the efficiency of ad spend, with lower CPCs generally indicating more efficient campaigns. However, it’s essential to balance CPC with traffic quality considerations to ensure that the campaign is not only cost-effective but also drives relevant traffic.
Return on Ad Spend (ROAS)
Return on Ad Spend (ROAS) is a critical KPI that measures the revenue generated for every dollar spent on advertising. It provides a direct financial perspective on advertising effectiveness and indicates whether a PPC campaign is delivering a profitable return.
A higher ROAS signifies better campaign performance and more efficient use of the ad budget. Advertisers should aim to maximize ROAS by optimizing ad targeting, ad copy, and landing pages.
Quality Score
Quality Score, provided by Google Ads, assesses the relevance and quality of ads, keywords, and landing pages. A higher Quality Score can lead to lower costs and better ad positions, making it a vital metric for search advertisers.
To improve Quality Score, ensure that ads are relevant to keywords, optimize landing pages for alignment with ad copy, and enhance the call-to-action (CTA).
View-Through Rate
View-Through Rate (VTR) is a metric used in video advertising to measure content engagement. It helps advertisers understand how compelling their video content is to the target audience.
A higher VTR indicates that the video content is engaging and resonates with viewers. Advertisers can use VTR to optimize video ad creative and improve campaign performance.
Lead Generation KPIs
To achieve sustainable business growth, companies must focus on key lead generation KPIs. These metrics provide insights into the effectiveness of marketing efforts and help identify areas for improvement. By tracking the right KPIs, businesses can optimize their lead generation strategies and drive more conversions.
Number of Marketing Qualified Leads (MQLs)
The number of Marketing Qualified Leads (MQLs) generated is a primary indicator of a marketing team’s ability to attract potential customers who match the ideal customer profile. MQLs are leads that have shown interest in a product or service and are likely to become customers. Tracking MQLs helps businesses understand the effectiveness of their marketing campaigns and make data-driven decisions.
Lead-to-Customer Conversion Rate
The Lead-to-Customer Conversion Rate measures the efficiency of the sales process in converting qualified leads into paying customers. This KPI highlights potential bottlenecks in the sales funnel and helps businesses identify areas for improvement. By optimizing the conversion rate, companies can increase revenue and drive business growth.
Cost Per Lead
Cost Per Lead (CPL) is a crucial metric that measures the expense of acquiring each lead. Tracking CPL across different channels and campaigns helps businesses assess the efficiency of their marketing efforts and optimize their budget allocation. By reducing CPL, companies can improve their return on investment (ROI) and drive more conversions.
Segmenting lead generation KPIs by source, campaign, and lead characteristics can reveal which marketing initiatives deliver the highest quality leads at the most reasonable cost. Additionally, tracking lead velocity rate—the month-over-month growth in qualified leads—can serve as a leading indicator of future revenue growth.
| KPI | Description | Importance |
|---|---|---|
| Number of MQLs | Measures the number of leads that are ready to take the next step in the buyer’s journey. | Indicates the effectiveness of marketing efforts in attracting potential customers. |
| Lead-to-Customer Conversion Rate | Measures the percentage of qualified leads that become paying customers. | Highlights the efficiency of the sales process and potential bottlenecks. |
| Cost Per Lead | Measures the expense of acquiring each lead. | Helps optimize marketing budget allocation and improve ROI. |
By focusing on these key lead generation KPIs, businesses can optimize their marketing strategies, drive more conversions, and achieve sustainable growth. Establishing service level agreements (SLAs) between marketing and sales teams around these metrics ensures alignment and accountability throughout the lead management process.
SEO Performance KPIs
![]()
To gauge the effectiveness of their SEO strategies, businesses rely on key performance indicators (KPIs) that measure search engine visibility and organic traffic growth. These metrics are crucial for understanding how well a website is optimized for search engines and how it compares to competitors.
Keyword Rankings
Keyword rankings are a fundamental SEO KPI, tracking the position of a website in search engine results for specific keywords. Tools like SEMrush or Ahrefs are invaluable for monitoring these rankings. A higher ranking typically translates to increased visibility and organic traffic.
Keyword rankings track your website’s visibility for target search terms, with positions in the top 10 results (first page) generating the vast majority of organic traffic.
Backlink Quality and Quantity
The quality and quantity of backlinks are critical indicators of a website’s link profile strength. Backlinks from reputable sites signal to search engines that the content is valuable and trustworthy. This KPI is essential for SEO as it directly influences search engine algorithms.
Backlink quality and quantity measure the strength of your website’s link profile, which remains one of the most important ranking factors.
Search Engine Results Page (SERP) Position
SERP position is a direct indicator of a website’s visibility in search results. The higher a website ranks, the more likely it is to be clicked. Studies have shown that the #1 result receives significantly more clicks than lower-ranked results.
SERP position directly impacts click-through rates, with the #1 result typically receiving 10 times more clicks than the #10 result.
Other important SEO KPIs include organic traffic growth over time, technical SEO metrics like page speed and mobile-friendliness, and content-specific KPIs such as organic landing page conversion rates. For businesses serving specific geographic areas, local SEO performance metrics like Google Business Profile views are also vital.
Event Marketing KPIs
To gauge the success of event marketing campaigns, businesses rely on key performance indicators (KPIs) that provide actionable insights. These metrics help in understanding the effectiveness of events in achieving marketing goals, from lead generation to customer engagement.
Registration vs. Attendance Rate
The Registration vs. Attendance Rate is a critical KPI that measures the percentage of registrants who actually attend the event. Industry benchmarks suggest that virtual events typically see attendance rates around 40-50%, while in-person events can have higher attendance rates, ranging from 60-70% post-pandemic. To ensure attendee goals are met, it’s advisable to aim for double the desired attendance in registrations.
Attendee Satisfaction Score
Attendee Satisfaction Score, often measured through Net Promoter Score (NPS) or custom satisfaction surveys, provides direct feedback on event quality and attendee experience. NPS measures the likelihood of attendees recommending the event to their peers on a scale of 1 to 10. A score between 6 and 10 is considered favorable.
Event-Generated Pipeline
The Event-Generated Pipeline quantifies the business impact of an event by tracking new opportunities created among attendees within a defined period, typically 90 days, following the event. This KPI is crucial for understanding the ROI of event marketing efforts.
| KPI | Description | Benchmark |
|---|---|---|
| Registration vs. Attendance Rate | Percentage of registrants who attend | 40-50% (Virtual), 60-70% (In-person) |
| Attendee Satisfaction Score | Measure of attendee satisfaction | NPS: 6-10 |
| Event-Generated Pipeline | New opportunities created post-event | Varies by industry and event goals |
Product Marketing KPIs
To gauge the success of product marketing efforts, businesses rely on key performance indicators (KPIs). These metrics provide insights into how well marketing strategies are working and where improvements can be made.
Product marketing KPIs are crucial for understanding customer behavior, preferences, and pain points. By tracking the right KPIs, businesses can refine their marketing strategies to better resonate with their target audience and drive growth.
Trial and Demo Signups
Tracking trial and demo signups helps you assess the effectiveness of your marketing messages and content. If signups are low, consider refining your marketing strategies and optimizing your sign-up page. This KPI serves as a leading indicator of product interest and marketing message effectiveness, directly connecting product marketing efforts to the sales pipeline.
Net Promoter Score (NPS)
NPS measures customer loyalty and satisfaction, providing insight into how likely your customers are to recommend your product to others—a critical factor for sustainable growth. A high NPS indicates satisfied customers who can bring in new leads. Use feedback to enhance your product and customer experience.
Feature Adoption Rate
Monitoring how users engage with different features of your product is crucial. This insight guides your product development and helps you understand what aspects your customers value most. The feature adoption rate tracks how effectively you’re communicating the value of specific product capabilities.
Other important product marketing KPIs include:
- Product knowledge metrics among sales teams and customers
- Win/loss analysis metrics
- Time-to-value metrics
- Upsell and cross-sell rates
- Customer stories and case studies generated
Implementing a KPI Tracking System for Marketing Success
A data-driven approach to marketing relies heavily on the implementation of a KPI tracking system. To measure the success of marketing campaigns, businesses must select the right tools for their needs. This includes analytics platforms, dashboard solutions, CRM systems, and channel-specific tracking software.
Establishing a regular reporting cadence is vital to ensure KPIs receive consistent attention. Different metrics require different review frequencies, ranging from daily to quarterly. Custom dashboards that visualize key metrics make data accessible to stakeholders across the organization, promoting a data-driven culture.
To evaluate performance effectively, setting realistic benchmarks and targets for each KPI is essential. Integrating data across platforms eliminates silos and provides a unified view of marketing performance. Implementing attribution modeling helps connect marketing efforts to business outcomes.
Regular KPI audits ensure that the metrics being tracked remain relevant as business objectives evolve. The most successful KPI tracking systems strike a balance between comprehensiveness and focus, providing meaningful insights without creating information overload.


